This site uses cookies to improve your experience. To help us insure we adhere to various privacy regulations, please select your country/region of residence. If you do not select a country, we will assume you are from the United States. Select your Cookie Settings or view our Privacy Policy and Terms of Use.
Cookie Settings
Cookies and similar technologies are used on this website for proper function of the website, for tracking performance analytics and for marketing purposes. We and some of our third-party providers may use cookie data for various purposes. Please review the cookie settings below and choose your preference.
Used for the proper function of the website
Used for monitoring website traffic and interactions
Cookie Settings
Cookies and similar technologies are used on this website for proper function of the website, for tracking performance analytics and for marketing purposes. We and some of our third-party providers may use cookie data for various purposes. Please review the cookie settings below and choose your preference.
Strictly Necessary: Used for the proper function of the website
Performance/Analytics: Used for monitoring website traffic and interactions
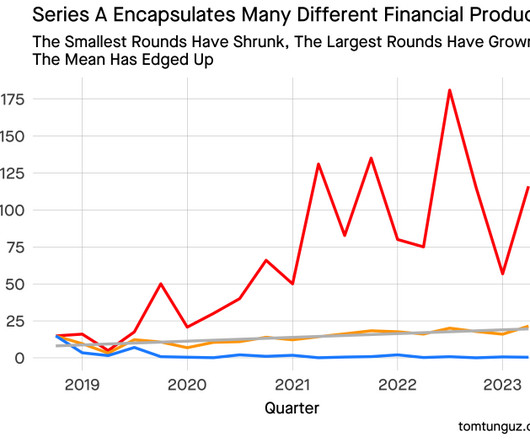
In There’s No Such Thing as Series A Metrics , Charles Hudson explains that there is no magic milestone to raise a Series A. The second reason for a lack of consistent metrics for Series A has to do with perturbations in purchasing behavior. In this environment, I agree. The $1m ARR figure used to hold in 2018 & early 2019.
Rep retention and ramp time metrics Manager participation in call reviews and coaching Team performance benchmarks across ACV, product mix, and sales cycles Forecast accuracy “I’ll take a manager who consistently gets more reps above 100% over one crushing their number with just two top performers,” Michelle noted.
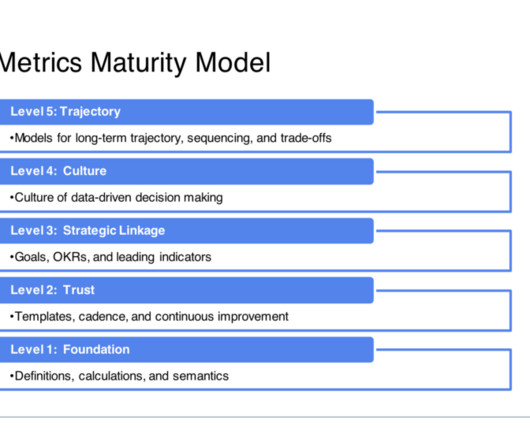
Dave Kellogg, EIR at Balderton Capital and 25-year C-level veteran, shares the top 14 signs that you have a SaaS metrics problem, the five reasons those symptoms exist, and a SaaS metrics maturity model with five layers to help you move the needle at every stage. The 15 Types of Misuse and Abuse of SaaS Metrics #1: Bludgeoning.
Radical Transparency in Growth Planning While most revenue leaders deliberately “sandbag” forecasts to ensure they can over-deliver, Colin Jones did the exact opposite at Wiz. This practical, observable metric drove more decision-making than sophisticated dashboards or forecasting models.
This keeps morale high and creates a very predictable revenue forecast. With this model, Twilio maintained contracted revenue at less than 50% of ARR while achieving industry-leading retention metrics. Vendors will all compete on percent improvement of the key metric, leading to discounting and price erosion.
How can we shift our mindset from reactive to future focused, from assessing past mishaps to forecasting ideal scenarios? Renewals forecasting was historically a sales game, but increasingly, CS teams are responsible for expansion revenue. Choose the right metrics to inform your forecasting model. Where can you start?
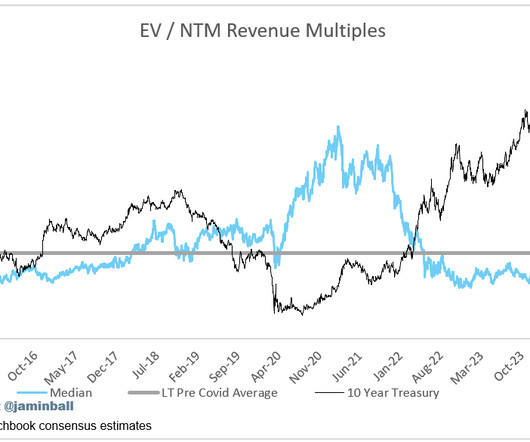
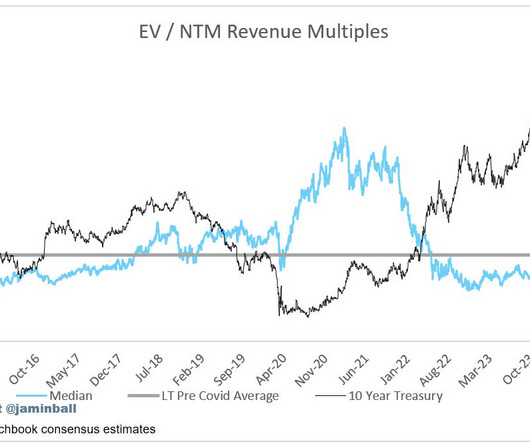
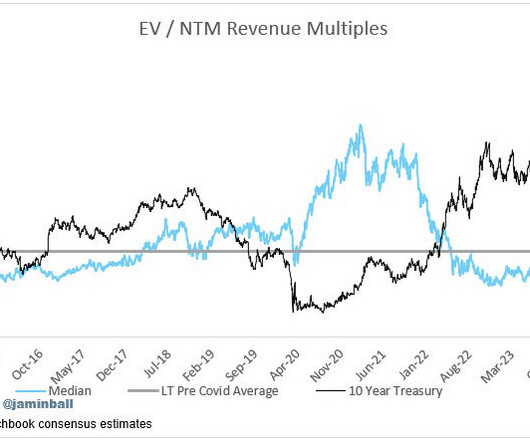
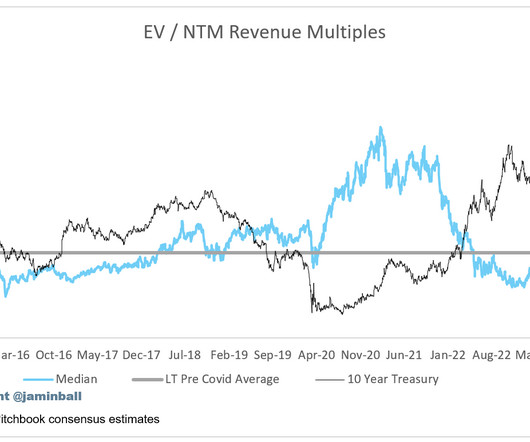
This week, we saw an economic forecast predict Q1 GDP to shrink nearly 3%. You can see in the graph below just how quickly these economic forecasts have changed. Given most software companies are not profitable, or not generating meaningful FCF, it’s the only metric to compare the entire industry against.
They’ve made it by using basic adoption metrics and a gut feeling about where customers will land with renewals. They’re expected to back up forecasts and gut feelings with data. Pull whatever adoption and usage metrics and rate their health score. Historically, customer success teams have been pretty data-poor.
72% of respondents have adjusted revenue targets and forecasts, or expect to soon. Only about 1% have seen a benefit and are increasing their forecasts. If you are a revenue leader or a CEO, these metrics may help you get a better grasp on what happening in the market and what changes you might make to your business.
Sales forecasting is challenging on its own and especially so when you have to combine it with a product-led motion. Derek Skaletsky has developed a framework to combine both sales-led and product-led efforts in a single forecast. Forecasting sales. And this model has taken the forecasting challenge to a whole other place.
This is the second in a three-part series focused on forecasting and pipeline. In part I , we examined triangulation forecasts with a detailed example. Thus, to keep it simple I base a lot of my pipeline metrics on week 3 snapshots (e.g., It provides a basis for snapshotting analytics. week 3 pipeline conversion rate) [9].
“Marketing is fluffy and unmeasurable” – Unlike sales, which has clear metrics like quota attainment, founders often believe marketing can’t be measured. Instead, focus on two key metrics: Pipeline coverage – Do we have a chance to hit our numbers? Actual sales – Did we hit our targets?
Sales forecasting: Over time, you should be able to determine a percentage likelihood of deals closing at each stage. These forecasts are an important budgeting tool and can help you identify gaps in your pipeline. Know what metrics you want to track. Design your sales process so you can report on key metrics.
With embedded applied AI and machine learning technologies built specifically for Finance, our platform automates and streamlines workflows, accelerates analysis and improves forecast accuracy, equipping the Office of the CFO to report on, predict and guide business performance. You can some metrics below based on different share prices.
After spending many quarters creating sales forecasts, you should have the process down and deliver precision accuracy. Unfortunately, sales forecasting is not that straightforward. In fact, 60% of forecasted deals don’t close, leading to uncomfortable conversations about budgets and with investors. What is sales forecasting?
It might also boost sales forecasting accuracy by using your enterprise’s historical transaction data to predict future trends more reliably. Given most software companies are not profitable, or not generating meaningful FCF, it’s the only metric to compare the entire industry against.
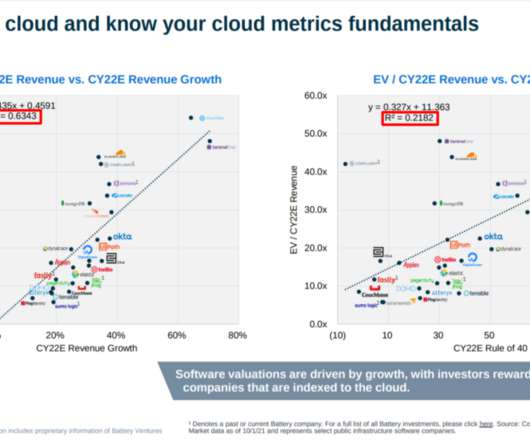
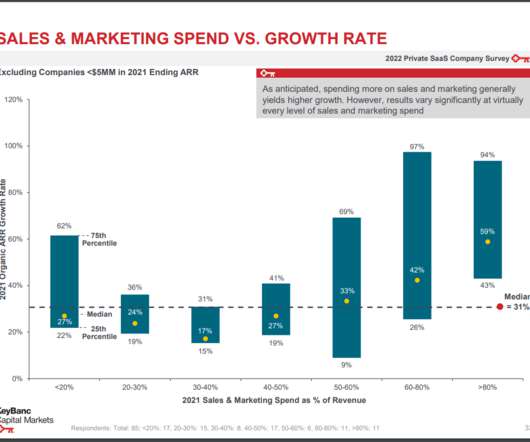
So when building out your forecast, do the math and work backwards to the top of funnel metrics you need under this 20-20-20 framework. #2 The favorable consumption-based pricing metrics on this Battery slide speak for themselves. 2 – Product Qualified Lead To Marketing Qualified Lead Ratio.
If you’re forecasting short on your global revenue target, do you know how you’ll make up the difference? Sales KPIs versus sales metrics: Is there a difference? Some might argue that there are fine-grained distinctions to be made between KPIs and metrics. That’s not a rhetorical question. Beware of headline KPIs.
Carefully forecast and re-forecast your Zero Cash Date. Your cash-out date is a dynamic metric. And make it as core to your investor-level metrics as your MRR is. #7. Improve How You Report Metrics, Especially Gross Margins. Too many founders were fast-and-loose with a lot of metrics the past few years.
Calmly re-forecast for the year based on a bottoms-up analysis (e.g., Just “cutting the burn” or freezing hiring isn’t a real, re-forecasted plan. Make NPS a Top 3 metric if it isn’t yet. Explain to the team, with data, why the company can calmly get through the next 12-18 months, or longer.
In an ideal world, sales teams and business leaders would have crystal balls to help them predict accurate sales forecasts. Then what’s the best way to go about creating sales forecasts for your business? Then what’s the best way to go about creating sales forecasts for your business? Con 1: Sales Forecasting Takes Time.
Using value metrics to optimize pricing. Before looking at all the different pricing models, you must measure your value metric. Knowing your value metric can help determine how much of the customer value you can monetize. How can you define your value metric in an optimal way? link your value metric to customer success.
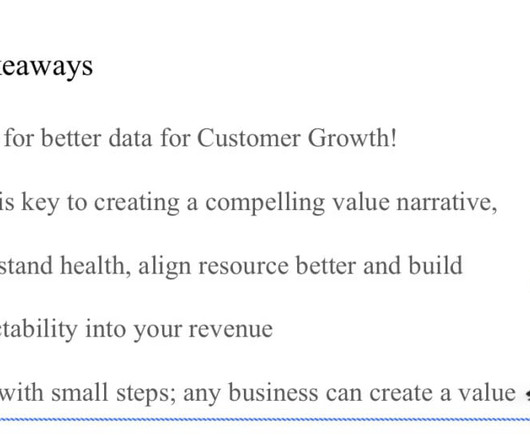
The original function of demand generation was about the top-of-funnel awareness and vanity metrics. Rather than operating on our own in silos, marketers must extend our focus beyond top-of-funnel metrics and partner with sales to create a pipeline velocity. . The purpose and limitations of demand generation. Key Takeaways.
Re-forecast cash — and Come Up With an Action Plan. Do a new forecast. Do not stick with the old forecast. They don’t re-forecast cash properly or their ZCD. Net net, four summary things I suggest after a Hard Miss: First , re-forecast revenue and cash — immediately. times out of 10. For real.
One metric I like to examine is how much companies adjust their full-year guidance. Generally, software companies follow a beat-and-raise model in their forecasts. There’s less margin for error in software forecasting, and “beats and raises” have become harder to achieve than ever before.
Depending on the stage and maturity of your business, how far can you realistically forecast, and how do you want to set up your process around that? You can set longer-term goals and know where you want to be, what strategy could get you there, and how to differentiate in the space, but tactically, how far ahead can you forecast?
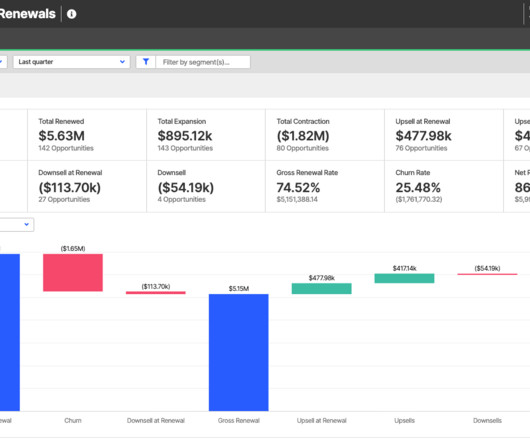
Better forecasts improve Customer Success’ standing There’s something in it for CS too. Forecasts help business leaders identify the risk of churn or opportunity of growth in terms of business impact. They rely on forecasts to secure funding and allocated resources. will renew, then $12,000 is in the forecast.
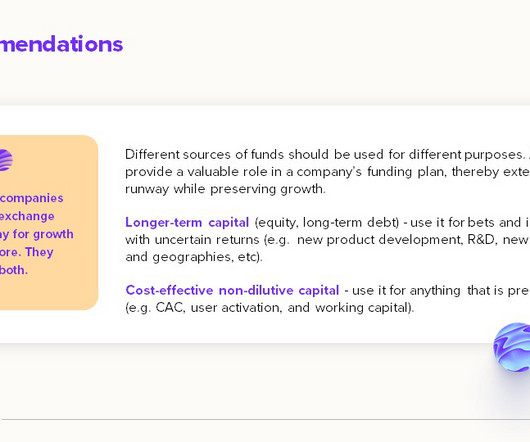
They are really, really good at forecasting. Recommendations Forecast in next-12-month increments, update your assumptions frequently, and build multiple scenarios. There’s a common error in that people set financial forecasts only at the beginning of their fiscal period and don’t revisit them.
This is a metric that needs to be “operationalized” by your various teams. A user engagement metric becomes tremendously helpful when comparing different populations of users. Correlate with other business metrics. “Product engagement is an essential metric? ?for Step 4: Give it context by normalizing raw scores.
Unlike Meritech Public Comps , where you can see metrics for the best [1], public SaaS companies, this private company data is somewhat harder to come by (the only other source that springs to mind is RevOps Squared ) and, for most of us, it provides much more realistic comparables than Meritech [2]. Everyone’s an optimist.
These metrics include monthly recurring revenue (MRR), customer acquisition cost, churn rate, customer lifetime value, etc. If you are a SaaS business owner, you can invest in analytics tools to get better insights and data to analyze these metrics and make actionable decisions.
What are your key Startup Metrics ? If you launched tomorrow, how many users would you forecast? Analytics/Metrics What key startup metrics will you need to track? What metrics will you need for future funding rounds or operations? Are there other founders, business leaders, partners, or administrators? Wireframes?
Few things instill confidence more than a crisp, metrics-filled monthly investor update that comes right after the month ends. Share those key metrics, plus some quick color. 6: Do a dynamic, rolling forecast of your revenue and zero-cash date. Don’t make this complicated. More on how to do this here.
These processes might include listening to employees, getting external feedback, or reviewing your metrics regularly. . If you ask a SaaS founder the most crucial metric for his sales pipeline, they’ll likely say MRR. However, the revenue forecast accuracy and the realization of that revenue each month are more important.
This is why median is a better metric in this case. The average doesn’t capture this concentration and the risk associated with assuming continued performance. Imagine the impact to attainment if a competitor were to poach Siana in Q1. The median attainment for scenario 1 is 80%, identical to the average. How does this hurt companies?
Just like we’re half-adjusted to shelter-at-home, most of us have now adjusted to new metrics in bookings, retention, and downgrades. Yes, most of you lowered your forecast for 2020 and even just decided to get through Q2 without any clear goals. But there are there at least in part. So I have a very simple suggestion.
In fact, monthly recurring revenue (MRR) is one of the most important metrics subscription businesses should be aware of. MRR is an important metric for SaaS businesses to track to understand business health. For subscription-based businesses achieving consistent and predictable revenue growth is the holy grail.
“The nice thing about metrics is that there are so many to choose from.” Translating it to metrics: Do we start every quarter with sufficient pipeline coverage ? ” — Adapted from Grace Hopper [1]. “Data, data everywhere. Nor any drop to drink.” Who Owns Pipeline Coverage and How to Measure It?
Tracking relevant product performance metrics allows you to assess how successful your product is at satisfying user needs and achieving business goals. What metrics should you track though? Our guide covers 11 key performance metrics to analyze at different stages of the customer journey. What are product performance metrics?
Wondering which customer engagement metrics to track? In this article, we discuss 12 key metrics you should cover – and why. TL;DR Customer engagement metrics measure how often customers interact with the product, how deep their involvement is, how satisfied they are with the product, and how valuable they find it.
You just need to ensure you can get started correctly and the metrics you should report on to get the critical metrics. TL;DR SaaS reporting helps to track key metrics and inform the right decisions backed up with data. Databox can take your data and help you visualize your key metrics.
For the majority of the software universe, Q4 earning season was not a catalyst for future forecasts to go up. Given most software companies are not profitable, or not generating meaningful FCF, it’s the only metric to compare the entire industry against. One positive has been the aggregate net new ARR growth in the quarter.
When it comes to SEO, forecasting can be a tricky concept. You’re trying to predict the future of your website’s traffic and search engine rankings, and oftentimes, it’s difficult to know what metrics to focus on, or if they are really giving you, your team, or your clients an actual picture.
Through these interactions, I’ve built up mental benchmarks for metrics on which I place extra emphasis. My hope is that this analysis can provide startup entrepreneurs with a framework for how to manage their businesses around SaaS metrics (e.g., This metric is more self-explanatory, so I won’t go into detail.
We organize all of the trending information in your field so you don't have to. Join 80,000+ users and stay up to date on the latest articles your peers are reading.
You know about us, now we want to get to know you!
Let's personalize your content
Let's get even more personalized
We recognize your account from another site in our network, please click 'Send Email' below to continue with verifying your account and setting a password.


Let's personalize your content