This site uses cookies to improve your experience. To help us insure we adhere to various privacy regulations, please select your country/region of residence. If you do not select a country, we will assume you are from the United States. Select your Cookie Settings or view our Privacy Policy and Terms of Use.
Cookie Settings
Cookies and similar technologies are used on this website for proper function of the website, for tracking performance analytics and for marketing purposes. We and some of our third-party providers may use cookie data for various purposes. Please review the cookie settings below and choose your preference.
Used for the proper function of the website
Used for monitoring website traffic and interactions
Cookie Settings
Cookies and similar technologies are used on this website for proper function of the website, for tracking performance analytics and for marketing purposes. We and some of our third-party providers may use cookie data for various purposes. Please review the cookie settings below and choose your preference.
Strictly Necessary: Used for the proper function of the website
Performance/Analytics: Used for monitoring website traffic and interactions
There’s a lot of info to digest, so in the sections below I’ll try and pull out the relevant financial information and benchmark it against current cloud businesses. ”” Benchmark Data The data shown below depicts how the ServiceTitan data compares to the operating metrics of current public SaaS businesses.
There’s a lot of info to digest, so in the sections below I’ll try and pull out the relevant financial information and benchmark it against current cloud businesses. The purpose of the detailed information is to help investors (both institutional and retail) make informed investment decisions.
There’s a lot of info to digest, so in the sections below I’ll try and pull out the relevant financial information and benchmark it against current cloud businesses. ” Benchmark Data The data shown below depicts how the Klaviyo data compares to the operating metrics of current public SaaS businesses.
In the language of SaaS, I churned. And the experience got me thinking: Was immediate removal of paid features the best chance to keep me from churning? When did I officially count as “churned”? Did they count me as churned on the day I canceled? In part one, we cover benchmarks and common churn formulas.
While doing some research for another post I just stumbled on this excellent overview from Pacific Crest on the churn rates of publicly listed SaaS companies. I’ve seen posts with churnbenchmarks of public SaaS companies before, but this one is by far the most comprehensive collection I’ve seen and I think it’s very useful.
Benchmark Data and Performance Metrics SaaStr sessions typically feature transparent sharing of key metrics and benchmarks that are otherwise difficult to access. Sessions often cover specific benchmarks for customer acquisition costs, churn rates, expansion revenue, sales efficiency, and other SaaS-specific metrics.
If we examine net dollar retention, the current value of last year’s cohort today net of churn and gross of expansion, we see Zoom is in the top decile at 140%. These customer acquisition paybacks resemble consumer acquisition figures more than software.
The “Rule of 40” is one of the most commonly cited valuation benchmarks in SaaS for both public and private companies. While SaaS is an amazingly transparent community with abundant benchmarking resources, there are much fewer publicly available studies that allow an analysis of the underlying drivers of “Rule of 40.”
Through these interactions, I’ve built up mental benchmarks for metrics on which I place extra emphasis. It is calculated by taking the annual recurring revenue of a cohort of customers from 1 year ago, and comparing it to the current annual recurring revenue of that same set of customers (even if you experienced churn).
This is the value of a cohort a year later inclusive of churn and expansion. Let’s compare PagerDuty to other recent software IPOs for companies selling to engineers at their IPO. Let’s first look at one of the key SaaS metrics: the dollar attention. PagerDuty is at 139%, which puts it smack in the midst of an exceptional group.
For every decision-maker in a SaaS company, understanding SaaS financial benchmarks makes a proper interpretation your internal performance metrics possible. All the data your startup needs Get deep insights into your company's MRR, churn and other vital metrics for your SaaS business. 2 Why use SaaS Financial Benchmarks?
The most successful companies recognize that fantastic docs drive adoption and bad ones cause customers to churn. Their performance benchmarks showing 10x query throughput compared to self-hosted options were eye-opening. The Numbers : Processing 1.2B vector queries daily. 230+ enterprise customers including three Fortune 50 companies.
The data is insightful both as a tool for benchmarking your own company and also to understand the mentality of sales leaders in this challenging time. About 54% of respondents have seen higher churn; the other half has seen no change. I’ve known Sam a long time and he’s done remarkable work with this community.
In this blog post, we have collected everything you need to know about churn — along with links to the best resources on the internet. You’ll never need to visit another site to learn about churn. Now you know — just mention churn. Definition of churn. Churn is a concept specific to subscription businesses.
We built the Baremetrics Benchmarks feature to answer these questions. We collected data from 800+ small and medium sized subscription companies using Baremetrics, anonymized it, and aggregated it to provide benchmark data for key metrics and subscription pricing. Where does the benchmark data come from? Table of Contents.
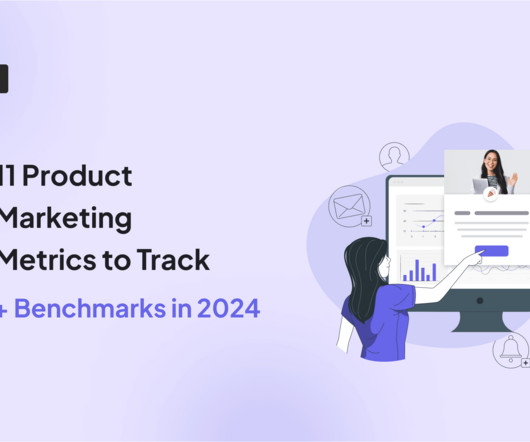
That said, let’s explore the most critical product marketing metrics to track, along with the latest benchmarks in 2024: Check out the 2024 Benchmark Report. Let’s explore the most important metrics (you can check their benchmarks here ): User activation rate : Measures how effectively onboarding converts new users into active users.
For example, all of your friends on Facebook or all of your co-workers on Slack makes it hard to churn from either product whereas churning from Calm or Grammarly is entirely up to you. * BONUS: Why are Casey’s benchmarks for consumer transactional businesses lower than others?
13: Mis-benchmarking. Some benchmarks are highly biased. Instead, benchmark by aspiration. If the VP of Customer Success says all customers who churned had multiple escalations because they didn’t have enough agents, so they hired more agents, that might be correct. This is when you are comparing to the wrong companies.
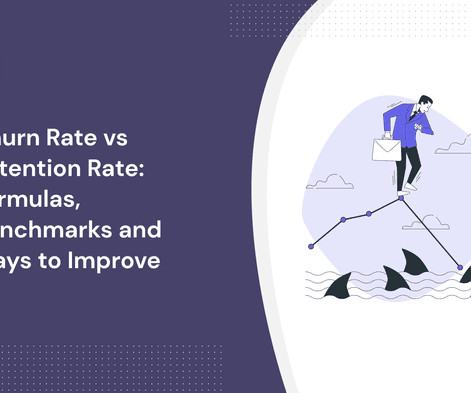
Wondering how churn rate vs retention rate are different? Other important metrics related to churn and retention efforts. Ways to analyze churn and improve retention rates based on the data. The churn rate refers to the percentage of customers discontinuing their subscriptions during a given time period.
According to our benchmark, the average month-1 retention rate in SaaS companies is 46.9%. Let’s explore our product metrics benchmark and learn: The definition of month-1 retention rate and why it matters. Offer consistent customer support : An in-app resource center and well-organized knowledge base reduce friction and prevent churn.
Tracking your customer churn rate will help you keep tabs on business growth. You will have data sets for analyzing your churn/retention history, which will better position you to make intelligent business decisions. Types of churn rates you should calculate: customer churn rate, revenue churn rate , and involuntary churn rate.
Confused about customer churn vs. revenue churn? Churn means lost money or lost customers. These metrics help you understand two different things: Customer churn — the number of people you've lost. Revenue churn — the amount of revenue you've lost. Customer churn = customers lost. Revenue churn = money lost.
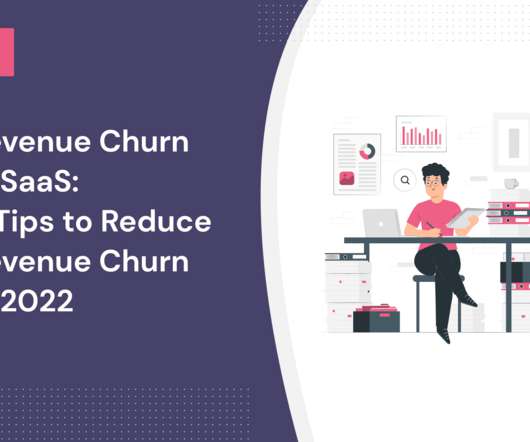
Looking for actionable tips to reduce revenue churn fast? As retention is extremely important for any SaaS company, reducing customer and revenue churn is a top priority. In this article, you'll learn everything you need to know about revenue churn and how to reduce it. What is revenue churn? Keep reading!
We track your progress and provide monthly executive level reporting on achievement against industry-recognized benchmarks and best practices. Upzelo helps you fight churn and increase retention through real-time data, customised offers and better customer feedback. We are not like other banks.
There’s a lot of info to digest, so in the sections below I’ll try and pull out the relevant financial information and benchmark it against current cloud businesses. ” Benchmark Data The data shown below depicts how the Rubrik data compares to the operating metrics of current public SaaS businesses.
As a caveat, I'm going to mention some benchmark numbers but it's very important to note that none of these numbers can be viewed in isolation. What's your account churn rate and more importantly your MRR churn rate ? The best SaaS companies have an account churn rate of less than 1.5%
Knowing how to fight customer churn is critical for keeping SaaS business models sustainable. The more customers you lose to churn, the more you have to invest in new customer acquisition to maintain your revenue, and the harder it becomes to grow your business. Here we’ll look at four proven strategies for reducing customer churn.
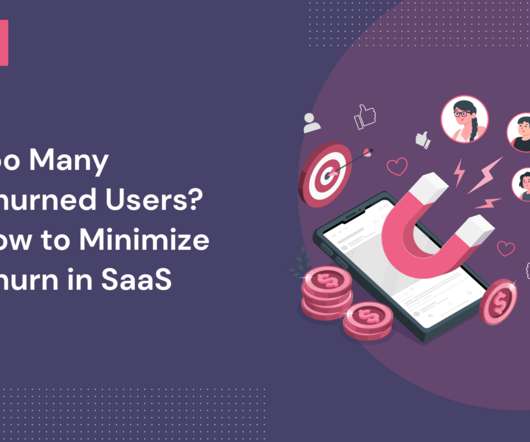
Churn is the enemy of product growth. A churned user means lost future revenue and a waste of the resources it took to acquire them. How do you lower your churn rate and make sure all your users stick around? In this article, we’ll show you: What customer churn is and why it matters. Let’s get started.
Wondering what customer satisfaction benchmarking is in SaaS and how your business compares to other SaaS companies? In this article, we go in-depth about customer satisfaction benchmarks and how you can measure and improve it. In the SaaS industry, the NPS benchmark is around 40. What is customer satisfaction benchmarking?
Churn analytics helps you detect your product friction points and understand why users stop using the tool. This is crucial if you want to know how healthy your SaaS product is and what should be improved to increase customer retention and lower the churn rate. A churn rate over 10 % indicates trouble. What is churn analytics?
In the report, they pursue the latest customer success trends and predictions, including significant challenges, top goals, team organization, key benchmarks, compensation and various technologies. . No longer is CS so heavily focused on churn alone. Rapid Onboarding (The First Value). Growing Value Through Nurturing.
We really like this metric because it encapsulates both the business’s ability to retain — so minimizing churn — and also their ability to upsell. See chapter 2 in the report to learn more about net retention benchmarks. That’s because, in B2C, churn is higher and expansion is lower. In contrast, 41.1%
If a business suffers from a very high churn rate, then, yes, it’s possible to calculate LTV in just a few years. But most software companies will see 10% or less unit churn per year. At 10% unit churn, three years from now, 73% of customers will still be paying, adding to their LTV. How long will those customers stay?
The company also unveiled ProfitWell Benchmarks to see how your company stacks up against similar firms. Head over to profitwell.com or profitwell.com/benchmarks to learn more about the announcements. announced “Tray Embedded,” a solution that helps companies quickly scale product integrations. Chargify.
It measures the value of a cohort of customers over time including expansion, cross-sell, and churn (loss of revenue). And the third principle is to benchmark your business to others who measure themselves in the same way. Net Dollar Retention is one of the most important metrics is a SaaS business. But how do you measure NDR?
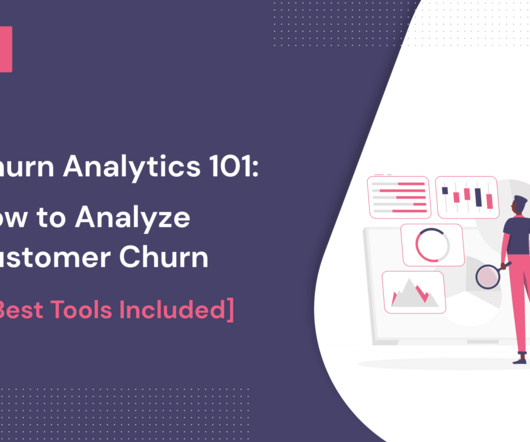
All SaaS companies can expect some level of customer churn. An upward trend in customer churn rate indicates a serious problem for your business both monetarily and reputationally. That’s why performing a customer churn analysis can be powerful in the endeavor to increase customer retention. What is Customer Churn Rate ?
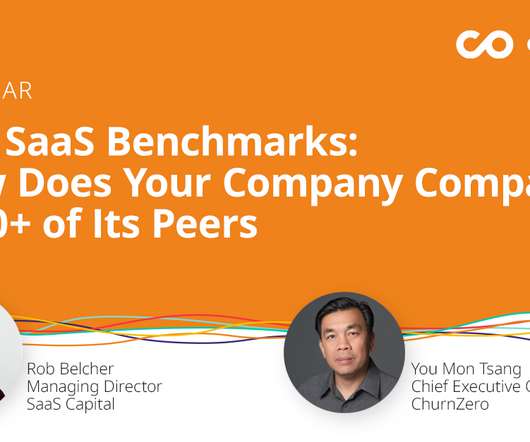
SaaS Capital joined us for a webinar to share the results from their 10th annual B2B SaaS benchmarking survey. We’ve seen in the data that there’s higher churn. They just need to be aware of it and that’s why this kind of thing is helpful with the benchmarking data that you can compare.
Today we’re focusing on actionable insights you can use to drive down churn with customer success in today’s new era of SaaS efficiency. This is great news because onboarding is one of the best ways to bring down churn for SMBs. If someone never starts or uses the product, they’ll churn.
Wondering how to reduce churn rate and increase retention? While customer churn is a grave concern, retention is what can help you tackle it and make your product successful. So, efforts to simultaneously reduce churn rate and increase retention are the formula to your product’s success. What is customer churn?
The average conversion rate from your SaaS free trial has a big impact on your product’s growth and blindly f ollowing benchmarks is not the best way to focus your efforts. SaaS free trial conversion rate benchmarks. SaaS free trial conversion rate benchmarks. Table of Contents. Conclusion. No coding required!
Benchmarking this crucial metric against your industry helps you assess your standing relative to your competition. In this article, we’ll delve into the ins and outs of CAC, its industry-specific benchmarks, and the proven practices to improve it. Ideally, the CAC should be around 1/3 or 1/4 of the LTV.
Through these interactions, I’ve built up mental benchmarks for metrics on which I place extra emphasis. The first few months of this year felt like a lot of churning in the market. Not surprisingly, these benchmarks match up relatively well with the numbers public companies reported. net retention and CAC payback).
Through these interactions, I’ve built up mental benchmarks for metrics on which I place extra emphasis. It is calculated by taking the annual recurring revenue of a cohort of customers from 1 year ago, and comparing it to the current annual recurring revenue of that same set of customers (even if you experienced churn).
Through these interactions, I’ve built up mental benchmarks for metrics on which I place extra emphasis. It is calculated by taking the annual recurring revenue of a cohort of customers from 1 year ago, and comparing it to the current annual recurring revenue of that same set of customers (even if you experienced churn).
We organize all of the trending information in your field so you don't have to. Join 80,000+ users and stay up to date on the latest articles your peers are reading.
You know about us, now we want to get to know you!
Let's personalize your content
Let's get even more personalized
We recognize your account from another site in our network, please click 'Send Email' below to continue with verifying your account and setting a password.


Let's personalize your content