This site uses cookies to improve your experience. To help us insure we adhere to various privacy regulations, please select your country/region of residence. If you do not select a country, we will assume you are from the United States. Select your Cookie Settings or view our Privacy Policy and Terms of Use.
Cookie Settings
Cookies and similar technologies are used on this website for proper function of the website, for tracking performance analytics and for marketing purposes. We and some of our third-party providers may use cookie data for various purposes. Please review the cookie settings below and choose your preference.
Used for the proper function of the website
Used for monitoring website traffic and interactions
Cookie Settings
Cookies and similar technologies are used on this website for proper function of the website, for tracking performance analytics and for marketing purposes. We and some of our third-party providers may use cookie data for various purposes. Please review the cookie settings below and choose your preference.
Strictly Necessary: Used for the proper function of the website
Performance/Analytics: Used for monitoring website traffic and interactions
There’s a lot of info to digest, so in the sections below I’ll try and pull out the relevant financial information and benchmark it against current cloud businesses. ”” Benchmark Data The data shown below depicts how the ServiceTitan data compares to the operating metrics of current public SaaS businesses.
There’s a lot of info to digest, so in the sections below I’ll try and pull out the relevant financial information and benchmark it against current cloud businesses. You can some metrics below based on different share prices. Financial and Operational Reporting. This implies roughly a $4.2 - $4.8b market cap, and a ~7.5x
Amplitude offers three key products: analytics for measuring user behavior, experiment for testing new user flows, and recommendation which optimizes content for different user segments. Revenue, $M. Revenue Growth. -. Gross Margin. Sales Efficiency. -. Net Income Margin. Cash Flow from Operations Margin.
These metrics are the result of exceptional product market fit. Expect this business to fetch stellar multiples, most likely similar to Atlassian because the revenue, growth rates, sales efficiency and profitability metrics are comparable. Exceptionally fast and efficient growth define Zoom, the next iconic video conferencing platform.
Download the report to learn more about: The strategies and technologies ABM marketers are using to increase ABM successes Why it’s important to shift toward more targeted, personalized assets How marketers are meeting buyers' demands for self-service journeys Which metrics and marketing KPIs matter across the ABM funnel
The event is known for its focused content on SaaS growth strategies, metrics, and best practices, making it particularly valuable for B2B SaaS companies. It’s the largest non-vendor SaaS conference in the world, typically drawing over 12,000 SaaS founders, executives, and investors.
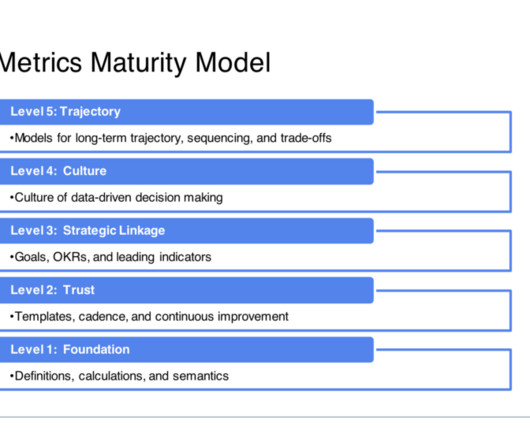
Dave Kellogg, EIR at Balderton Capital and 25-year C-level veteran, shares the top 14 signs that you have a SaaS metrics problem, the five reasons those symptoms exist, and a SaaS metrics maturity model with five layers to help you move the needle at every stage. The 15 Types of Misuse and Abuse of SaaS Metrics #1: Bludgeoning.
Let’s first look at one of the key SaaS metrics: the dollar attention. Comparing the metrics to other world-class companies, we can see that PagerDuty’s metrics are clearly the top decile, and represent another fantastic software IPO. The average customer is worth about $10,000.
There’s a lot of info to digest, so in the sections below I’ll try and pull out the relevant financial information and benchmark it against current cloud businesses. ” Benchmark Data The data shown below depicts how the Klaviyo data compares to the operating metrics of current public SaaS businesses.
Rep retention and ramp time metrics Manager participation in call reviews and coaching Team performance benchmarks across ACV, product mix, and sales cycles Forecast accuracy “I’ll take a manager who consistently gets more reps above 100% over one crushing their number with just two top performers,” Michelle noted.
Sessions typically focus on real metrics, strategies, and lessons learned, not theoretical concepts. Benchmark Data and Performance Metrics SaaStr sessions typically feature transparent sharing of key metrics and benchmarks that are otherwise difficult to access. Get out of the home office. Pull together the team.
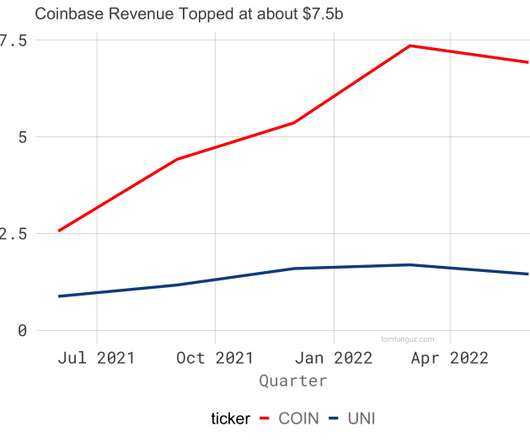
But revenue growth is more sensitive to market swings, the company discloses fewer operating metrics, and their token offers fewer rights than COIN stock. Uniswap grows MTUs faster, likely generates significantly more profit, and has fallen less. If an investor values profit margin over dividend rights, then yes.
Dan, a Stanford-trained engineer with experience guiding companies like Intuit, understands how to optimize your product metrics for growth by focusing on retention and building a product users truly value. Understanding the product metrics Let’s have two products – A and B. The key is to go beyond surface-level metrics.
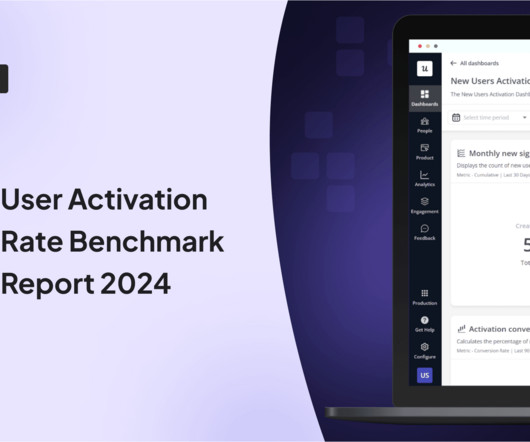
Userpilot’s SaaS Product MetricsBenchmark Report has found that compared to other industries, healthcare SaaS companies perform lower across most of the 6 metrics we studied. You will also learn how healthcare companies can improve their product metrics. In the report, we look into 6 metrics: New user activation rate.
Celebrations are shifting from contract signatures to consumption metrics – Their team is evolving beyond celebrating closed deals to automated alerts for customer usage milestones, fundamentally changing what success looks like. “Too many metrics meant no clear priorities.”
For context, the Rule of 40 is a benchmark for SaaS companies that adds revenue growth rate and profit margin, with 40% considered healthy. With 39% revenue growth and 44% adjusted operating margin, Palantir is doubling the benchmark threshold. [link] — Akshay Krishnaswamy (@hyperindexed) May 5, 2025 5 Interesting Learnings: 1.
To put the company’s stellar trajectory in context, I’ve plotted its metrics relative to two other incredible monitoring companies: NewRelic (NEWR) and AppDynamics (APPD). This is a measure of turning investment dollars into revenue, a sort of return on equity metric. Look at that beautiful curve! as of this morning.
Focus on the right metrics : Be transparent about your key metrics rather than relying on vanity numbers. Run an intentional process : Be strategic about your fundraising approach rather than scattershot or overly compressed. Allow time to build relationships with potential investors.
MarTech companies had the lowest onboarding c completion rates of all the industries we studied for our SaaS Product MetricsBenchmark Report. Does it have any impact on new user activation, time-to-value, or other metrics? We also show you how you can improve the key success metrics for your MarTech SaaS. How to do it?
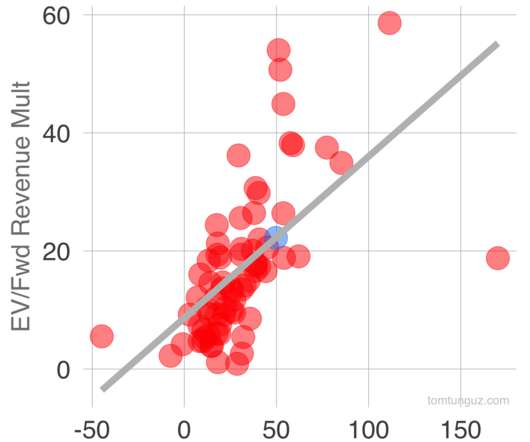
In his highly informative session, Tomasz Tunguz, the Managing Director at Redpoint Ventures, shares the essential benchmarks you need to track your company’s valuation and where to look to make improvements. The Five Metrics to Help Increase Your Value. # Revenue Design: Valuing a Software Company. 1 Revenue Growth. Key Takeaways.
An ERP vendor can see average inventory levels or key financial metrics. Benchmarks are useful Of course, SaaS vendors need to be very careful to share only aggregate data. Benchmarks are useful Of course, SaaS vendors need to be very careful to share only aggregate data. That information is valuable.
Product marketing metrics are key for understanding and optimizing the performance of your product. That said, let’s explore the most critical product marketing metrics to track, along with the latest benchmarks in 2024: Check out the 2024 Benchmark Report.
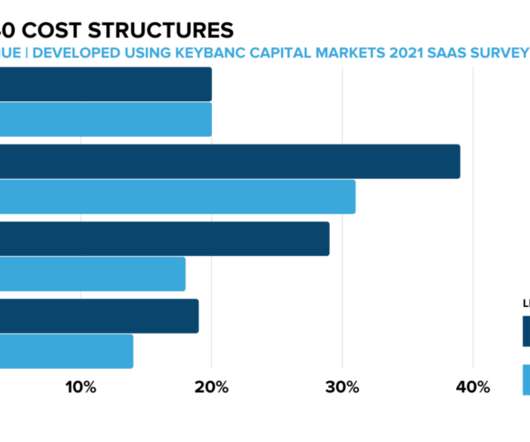
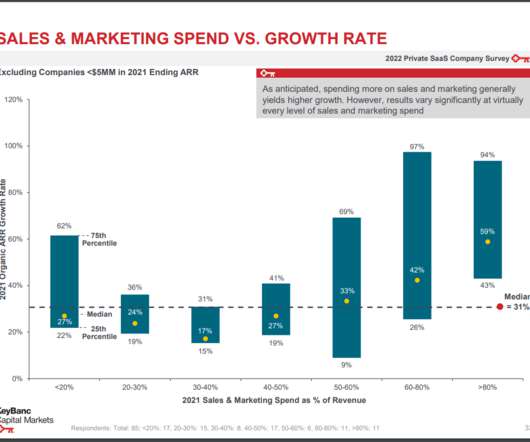
It contains data on go to market team structure, performance by sales function, marketing spend benchmarks, and customer success priorities. We’ve endeavored to include as much data as possible to help companies benchmark themselves relative to others. Just pick a metric. The presentation is embedded below.
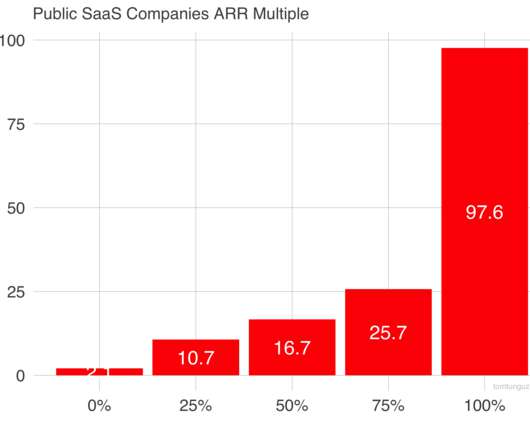
Before, most investors used forward ARR multiples to value companies, but recently, the 100x multiple seems to be a benchmark for SaaS companies raising rounds. Second, the correlation between the two metrics and revenue growth is identical at about 36%. I wonder if it’s the right metric long term.
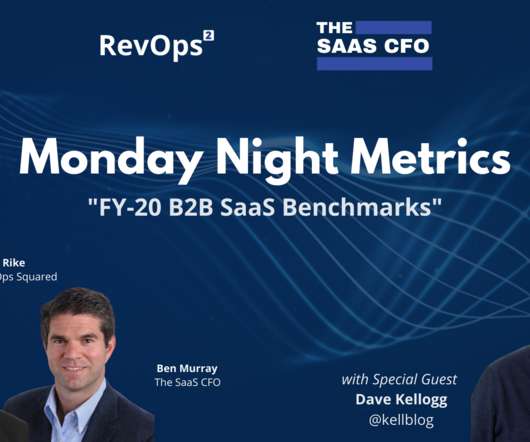
The purpose of this post is to embed the video recording of my recent appearance on Monday Night Metrics with Ray Rike of RevOps^2 and Ben Murray , also known by the sobriquet, The SaaS CFO. Here’s the video: Thanks to Ray and Ben for having me!
This is where metrics can be invaluable, giving clarity on performance, and circumventing potential issues. But with so much data to consider, how can you define the help desk metrics that matter for your team? What are help desk metrics? Help desk metrics vs. KPIs. Ticket volume or total conversations.
Not sure what metrics you should use? One way to measure your Martech product success is by using benchmarks to compare its performance to similar products. One way to measure your Martech product success is by using benchmarks to compare its performance to similar products. SaaS Product Success Metrics Report 2024.
Through these interactions, I’ve built up mental benchmarks for metrics on which I place extra emphasis. My hope is that this analysis can provide startup entrepreneurs with a framework for how to manage their businesses around SaaS metrics (e.g., This metric is more self-explanatory, so I won’t go into detail.
“Marketing is fluffy and unmeasurable” – Unlike sales, which has clear metrics like quota attainment, founders often believe marketing can’t be measured. Instead, focus on two key metrics: Pipeline coverage – Do we have a chance to hit our numbers? Actual sales – Did we hit our targets?
That’s one of the questions about user activation rates that we explore in our Product MetricsBenchmark Report 2024. Companies analyzed in the Product MetricsBenchmark Report by industry. Activation has an impact on other product metrics , including revenue. Userpilot’s SaaS Product MetricsBenchmark Report 2024.
In part one, we cover benchmarks and common churn formulas. Part I: SaaS Churn Benchmarks Part II: 5 Proven Strategies for Reducing SaaS Churn Part III: Churn Definitions and Additional Resources. Part I: SaaS Churn Benchmarks. When we set churn benchmarks for SaaS companies, there’s so much to consider.
The “Rule of 40” is one of the most commonly cited valuation benchmarks in SaaS for both public and private companies. The SaaS “Rule of 40” has gained popularity due to its simplicity, requiring only two common financial metrics to be added together. Ultimately, the “Rule of 40” is ONLY a metric.
Unlike Meritech Public Comps , where you can see metrics for the best [1], public SaaS companies, this private company data is somewhat harder to come by (the only other source that springs to mind is RevOps Squared ) and, for most of us, it provides much more realistic comparables than Meritech [2]. See slide 13 of this presentation. [3]
Looking for reliable metricsbenchmarks to gauge your product performance and inform your decisions? That’s what you can find in Userpilot’s Product MetricsBenchmark Report. Want to improve your key product metrics with Userpilot? It looks into 6 key metrics: User Activation Rate. Book the demo!
Here’s a list of the seven best competitor analysis tools to help you get detailed data on your rivals, analyze trends they use, and get a wholesome picture of competitor performance — benchmarked against yours. You can filter for views per hour (VPH), publishing date, views, and performance metrics.
The data is insightful both as a tool for benchmarking your own company and also to understand the mentality of sales leaders in this challenging time. If you are a revenue leader or a CEO, these metrics may help you get a better grasp on what happening in the market and what changes you might make to your business.
I have to say it was a combination of luck and foresight that I started talking with Allan Wille and Lauren Thibodeau about capital efficiency as a potential topic for their Metric Stack podcast many months ago. Using my formula (= 1/CCS) for aggregate burn, here are some benchmarks. < < 1 is amazing (i.e., 1-2 is good (i.e.,
These are the key questions we explore in the article based on our recent Product MetricsBenchmark Report 2024 which investigates company performance in 6 different metrics across 7+ industries. Companies analyzed in the SaaS Product MetricsBenchmark Report 2024 by industry. Book the demo!
Learn more about industry benchmarks in our latest SaaS Product Metrics Report. Customer activation rate is crucial for SaaS companies as it impacts all other success metrics, like revenue. Activation rate benchmarks for various industries in 2024 range from 54.8% User activation rate benchmarks in 2024.
With the able help of Michael Lavner , we did a special, live presentation and discussion of my KiwiSaaS talk, Metrics That Matter in 2023 , for Balderton portfolio executives. Growth endurance (also known as growth retention or growth persistence) as an increasingly popular metric. I love that quote.)
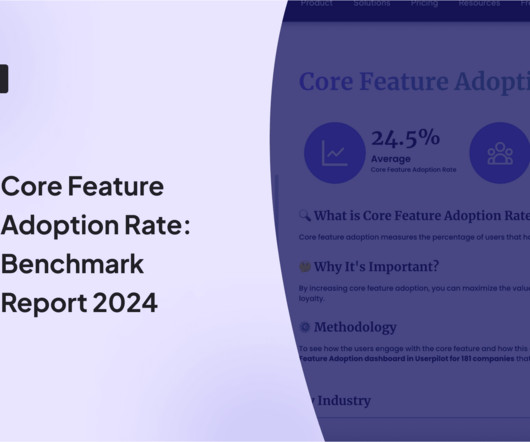
That’s the average core feature activation rate across the companies we studied for our Product MetricsBenchmark Report 2024. Companies by industry analyzed in our Product MetricsBenchmark Report 2024. Check out our Product MetricsBenchmark Report 2024. respectively). Book the demo!
According to our latest NPS benchmark report, the average NPS in SaaS is 35.7. But how does your business fare against these product metricsbenchmarks? Let’s explore our product metricsbenchmark and learn: What NPS is and why it’s important for SaaS businesses. Companies analyzed. What is NPS?
One metric I wanted to highlight. A related post here: Dear SaaStr: What’s a Good Benchmark for B2B Sales Cycles? So Vendr has their latest SaaS Buyer Report out here. There’s plenty of good data in there and it’s worth a read. And look, average sales cycles are almost meaningless. Bigger deals take longer.
According to our benchmark, the average month-1 retention rate in SaaS companies is 46.9%. Let’s explore our product metricsbenchmark and learn: The definition of month-1 retention rate and why it matters. Check our product metricsbenchmark report. Average month-1 retention statistics for different segments.
We organize all of the trending information in your field so you don't have to. Join 80,000+ users and stay up to date on the latest articles your peers are reading.
You know about us, now we want to get to know you!
Let's personalize your content
Let's get even more personalized
We recognize your account from another site in our network, please click 'Send Email' below to continue with verifying your account and setting a password.


Let's personalize your content