This site uses cookies to improve your experience. To help us insure we adhere to various privacy regulations, please select your country/region of residence. If you do not select a country, we will assume you are from the United States. Select your Cookie Settings or view our Privacy Policy and Terms of Use.
Cookie Settings
Cookies and similar technologies are used on this website for proper function of the website, for tracking performance analytics and for marketing purposes. We and some of our third-party providers may use cookie data for various purposes. Please review the cookie settings below and choose your preference.
Used for the proper function of the website
Used for monitoring website traffic and interactions
Cookie Settings
Cookies and similar technologies are used on this website for proper function of the website, for tracking performance analytics and for marketing purposes. We and some of our third-party providers may use cookie data for various purposes. Please review the cookie settings below and choose your preference.
Strictly Necessary: Used for the proper function of the website
Performance/Analytics: Used for monitoring website traffic and interactions
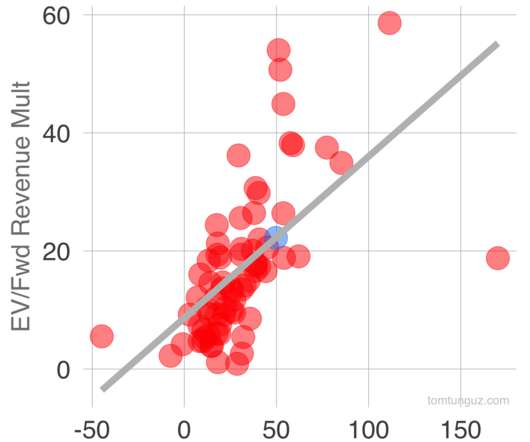
There’s a lot of info to digest, so in the sections below I’ll try and pull out the relevant financial information and benchmark it against current cloud businesses. ”” Benchmark Data The data shown below depicts how the ServiceTitan data compares to the operating metrics of current public SaaS businesses.
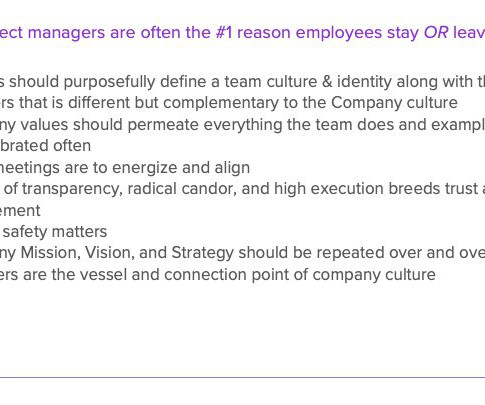
Former Head of Revenue at BILL and HubSpot Americas leader Michelle Benfer recently joined us on a SaaStr Workshop Wednesday share her insights on one of the most critical roles in any SaaS organization: the frontline sales manager. “At HubSpot, I had over 100 frontline sales managers reporting to me.
A little ways back Databricks VP of Sales Heather Akuiyibo joined SaaStr to share unexpected things that work well at Databricks GTM organization as well as some things that havent worked as well. Deep Dive: Unexpected Learnings Time Management as Competitive Advantage Most sales organizations guess how reps should spend their time.
Dear SaaStr: What’s a Good Benchmark for B2B Sales Cycles? To overgeneralize, but to give you a pretty rough sense: Sales cycles are very much impacted by the intent of the prospect. More here : The post Dear SaaStr: What’s a Good Benchmark for B2B Sales Cycles? appeared first on SaaStr.
Marketing and sales teams are feeling pressured to deliver authentic messaging to buyers at every point of their customer journey. Database benchmarks for education and resource prioritization. 47% of marketers said they have a database management strategy in place, but there is room for significant improvement.
It’s almost time again for Cyber Weekend, and November sales spikes aren’t just for holiday gifts and physical goods — SaaS and software companies also benefit from this annual increase in sales. trends in year-end SaaS and software sales data. Up-to-date global trends in year-end SaaS and software sales data.
When you’re expanding your software business into new regions, industry benchmarking data can help you make better strategic decisions by answering important questions about business in the region. Benchmarking Data and Insights on SaaS Subscriptions in Asia appeared first on FastSpring. The post Breaking Into Asia?
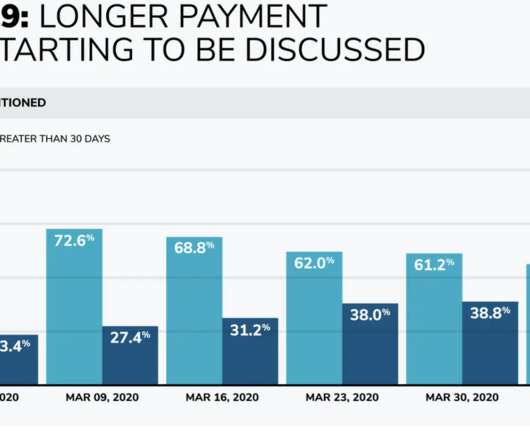
How do you benchmark a sales organization in a time like this? Using data across 10m telephone calls, Jim highlights how the coronavirus is changing sales team performance. Timeline risk, the likelihood a sale drags to a close, has doubled to about 2% of calls. In early March, 75% of sales conversations discussed net 30.
That ties to our overall rough sales cycle data here: Dear SaaStr: What’s a Good Benchmark for B2B Sales Cycles? The findings arent much different from what weve discussed before at SaaStr, but still very helpful to see, given how much data they are pulling from: On average, $100k deals take about 70 days to close.
There’s a lot of info to digest, so in the sections below I’ll try and pull out the relevant financial information and benchmark it against current cloud businesses. Over the lifetime of the customer relationship, we also incur sales and marketing costs related to upselling and expanding the number of users accessing our platform.
The report uses data from 5m sales and customer calls to benchmarksales team performance. For example, the typical win rate of a sales qualified lead is 19%. And the typical sales manager reviews only 8% of calls, but the best managers spend much more. There’s lots of great data in the report.
It’s live on SaaStr.com itself and you can also access it here and talk to AI Jason about any of 1000s and 1000s of B2B, sales, SaaS, VC, etc. Here are some of the top ones: “How My VP, Sales Doubled Our Sales in 90 Days. Here are some of the top ones: “How My VP, Sales Doubled Our Sales in 90 Days.
How do you benchmark a sales organization in a time like this? Using data across 10m telephone calls, Jim highlights how the coronavirus is changing sales team performance. Timeline risk, the likelihood a sale drags to a close, has doubled to about 2% of calls. In early March, 75% of sales conversations discussed net 30.
Key points about SaaStr Annual : Focus on SaaS: Primarily focused on all aspects of SaaS business including sales, marketing, product development, and customer success. Large Audience: Considered the biggest SaaS conference with a large number of attendees from leading SaaS companies, startups, and venture capital firms.
There’s a lot of info to digest, so in the sections below I’ll try and pull out the relevant financial information and benchmark it against current cloud businesses. ” Benchmark Data The data shown below depicts how the Klaviyo data compares to the operating metrics of current public SaaS businesses.
Sales cycles shifted dramatically in 2023. Slower sales cycles create pipeline shocks & startups are feeling the impacts. The average startup saw a 24% increase in sales cycle from early 2022 to 2023. 60 day sales cycles are now 75 days. But the latency isn’t evenly distributed.
Sam Jacobs created the Revenue Collective , a group of more than 1700 sales professionals at some of the fastest-growing companies. With chapters across the US, Revenue Collective has broad reach within the sales community. Typically, sales leaders have reduced quota somewhere between 10-50%. You can download the survey here.
SaaStr Annual attracts thousands of high-quality SaaS professionals across functions like engineering, product, marketing, sales, and customer success. Benchmark Data and Performance Metrics SaaStr sessions typically feature transparent sharing of key metrics and benchmarks that are otherwise difficult to access.
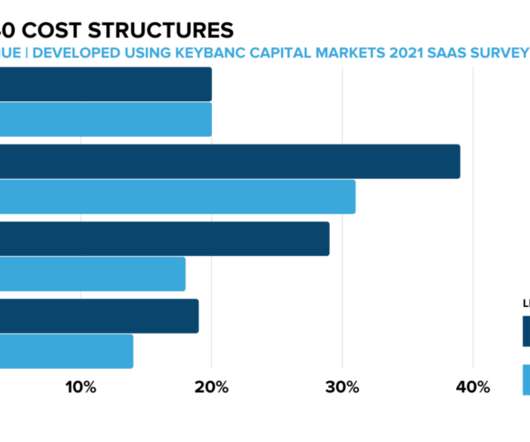
Sales Efficiency. -. The first is sales efficiency. The company spent $47m in 2019 on sales and marketing, and $52m in 2020, an increase of $3m or 6%, while growing revenues 49%. The 2020 sales efficiency is 0.54. Assuming current trends hold, sales efficiency in 2021 should nudge up to about 0.57. Revenue, $M.
How much should a SaaS startup invest in sales and marketing at different stages of the business? This is a very nuanced question, but benchmarks do provide some guidance for what is reasonable. The chart above shows the sales and marketing investment of publicly traded software companies at different revenue levels.
A CRM vendor can see the ratio of opportunities per lead and the average length of the sales cycle. A vendor that hosts a solution for car dealers, for example, can see the average sales per month, the value of extras sold with each vehicle, and the average time a vehicle stays on the lot. That information is valuable.
sales efficiency, meaning one dollar of sales and marketing spend results in $1.80 Expect this business to fetch stellar multiples, most likely similar to Atlassian because the revenue, growth rates, sales efficiency and profitability metrics are comparable. In addition to reduced labor costs, Zoom benefits from a 1.8
All of these benchmarks are machine-generated : HumanEval & HumanEvalFIM are not human testers - but open-source projects that evaluate AI code. The generic tests probably won’t work, which translates to slower sales cycles as prospective buyers understand the system’s performance in their own context.
The 4 Things Most Founders Get Wrong About Marketing: “We’re a product company, not a marketing company” – The hard truth is that 9 out of 10 B2B companies spend more on sales and marketing than R&D. Mix in the classic conflict between sales and marketing teams, and you’ve got a recipe for disaster.
It contains data on go to market team structure, performance by sales function, marketing spend benchmarks, and customer success priorities. We’ve endeavored to include as much data as possible to help companies benchmark themselves relative to others. The presentation is embedded below. Just pick a metric.
So how do you simplify and speed up your sales cycles? He started as the first sales hire at TripActions when the company was small and he helped scale the business to 5,000 customers, 1,200 employees and a $5 billion private valuation. Read on for Michael’s insightful advice for driving faster sales cycles. Sales Enablement.
Next, let’s compare the sales efficiency. Sales efficiency is a measure of the marginal gross profit generated by a dollar invested in sales and marketing. According to the recent Redpoint free trial survey, the 140% net retention puts the business in the top decile of businesses.
A CMO might come in saying they generated 1200 MQLs last quarter, yet sales feel like they’re starving. For example, if you ask your VP sales for their commit and they say “$4.3M How you really want your VP Sales to answer (and the answer you want to receive) should be the answer/number that you have a 90% confidence level in.
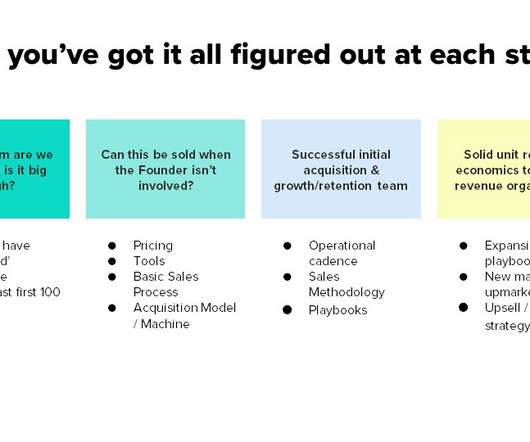
How do you build a sales organization from scratch? What about moving from founder-led sales to building a sales team and scaling your revenue growth? Hitting $1M ARR is the benchmark to figure out if you have a product-market fit.” – Veronika Riederle, CEO @Demodesk. Build a predictable sales process.
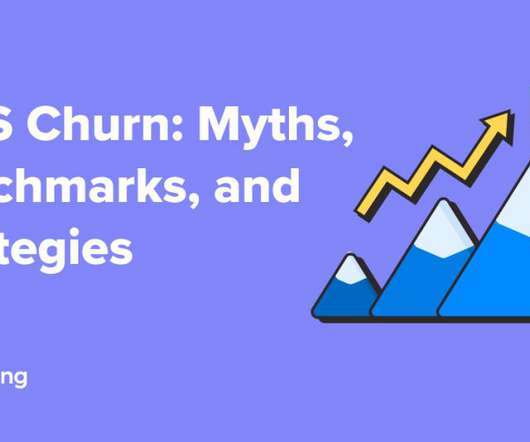
In part one, we cover benchmarks and common churn formulas. Part I: SaaS Churn Benchmarks Part II: 5 Proven Strategies for Reducing SaaS Churn Part III: Churn Definitions and Additional Resources. Part I: SaaS Churn Benchmarks. When we set churn benchmarks for SaaS companies, there’s so much to consider.
We automated contact centers employing >100 human agents and now handle their incoming customer support and sales calls, end-to-end. Their performance benchmarks showing 10x query throughput compared to self-hosted options were eye-opening. All while maintaining 90% customer satisfaction score. The Numbers : Processing 1.2B
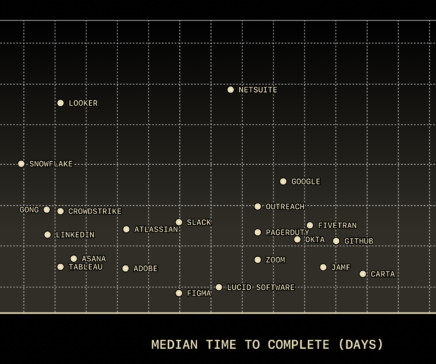
Sales-led companies have a higher user activation rate than product-led companies. That’s one of the questions about user activation rates that we explore in our Product Metrics Benchmark Report 2024. Companies analyzed in the Product Metrics Benchmark Report by industry. Userpilot’s SaaS Product Metrics Benchmark Report 2024.
The “Rule of 40” is one of the most commonly cited valuation benchmarks in SaaS for both public and private companies. While SaaS is an amazingly transparent community with abundant benchmarking resources, there are much fewer publicly available studies that allow an analysis of the underlying drivers of “Rule of 40.”
Q4 sales numbers usually outperform the rest of the year thanks to year-end holidays and their associated shopping cycles — but how much does that trend carry over into software and SaaS sales? And does it improve B2B sales too, or is it more just a B2C advantage? sales trends by month and quarter.
Recently, we’ve seen a series of product-driven companies building huge customer bases with tremendous account expansion and terrific sales efficiency. Here’s why: For every dollar of sales and marketing investment, DataDog generates $1.68 DataDog is no exception. An amazing feat to be growing fast at scale and profitable.
These are three of the lessons that stood out to me espcially managing the transition from product to sales-led growth (PLG -> SLG). Second, the PLG -> SLG (sales-led growth) transition has two parts. But more important, the sales pitch must also change (in addition to the pricing/packaging). First, revenue is fuel.
In this session, Notion’s CRO, Erica Anderson, and GitHub’s VP of Customer Success, Abbas Haider Ali, discuss how customer success teams can take a proactive approach to drive sales. They’ll explore strategies for using customer success not just as a support function but as a powerful engine for revenue growth.
Product-led ones than sales-led ones? These are the key questions we explore in the article based on our recent Product Metrics Benchmark Report 2024 which investigates company performance in 6 different metrics across 7+ industries. Companies analyzed in the SaaS Product Metrics Benchmark Report 2024 by industry. Book the demo!
And look, average sales cycles are almost meaningless. A related post here: Dear SaaStr: What’s a Good Benchmark for B2B Sales Cycles? So Vendr has their latest SaaS Buyer Report out here. There’s plenty of good data in there and it’s worth a read. One metric I wanted to highlight. Bigger deals take longer.
That’s the average core feature activation rate across the companies we studied for our Product Metrics Benchmark Report 2024. Companies by industry analyzed in our Product Metrics Benchmark Report 2024. Sales-led companies had higher core feature adoption rates than product-led ones (26.7% respectively). respectively).
That said, let’s explore the most critical product marketing metrics to track, along with the latest benchmarks in 2024: Check out the 2024 Benchmark Report. Let’s explore the most important metrics (you can check their benchmarks here ): User activation rate : Measures how effectively onboarding converts new users into active users.
Rajeev Dham and Karan Singh, Partners at Sapphire Ventures, and Jane Lee, Vice President at Sapphire walk us through how to double your “Magic Number,” a shorthand for your sales and marketing efficiency. Magic Number is your growth in ARR over a quarter divided by the sales and marketing spend in the prior quarter. Let’s find out.
According to our benchmark, the average month-1 retention rate in SaaS companies is 46.9%. Let’s explore our product metrics benchmark and learn: The definition of month-1 retention rate and why it matters. Check our product metrics benchmark report. CRM & Sales : 52.5% What is the month-1 retention rate? HR : 41.4%
Learn more about industry benchmarks in our latest SaaS Product Metrics Report. Activation rate benchmarks for various industries in 2024 range from 54.8% User activation rate benchmarks in 2024. Here's what we've found: AI & Machine Learning: 54.8% (average activation rate) CRM & Sales: 42.6%
We organize all of the trending information in your field so you don't have to. Join 80,000+ users and stay up to date on the latest articles your peers are reading.
You know about us, now we want to get to know you!
Let's personalize your content
Let's get even more personalized
We recognize your account from another site in our network, please click 'Send Email' below to continue with verifying your account and setting a password.


Let's personalize your content